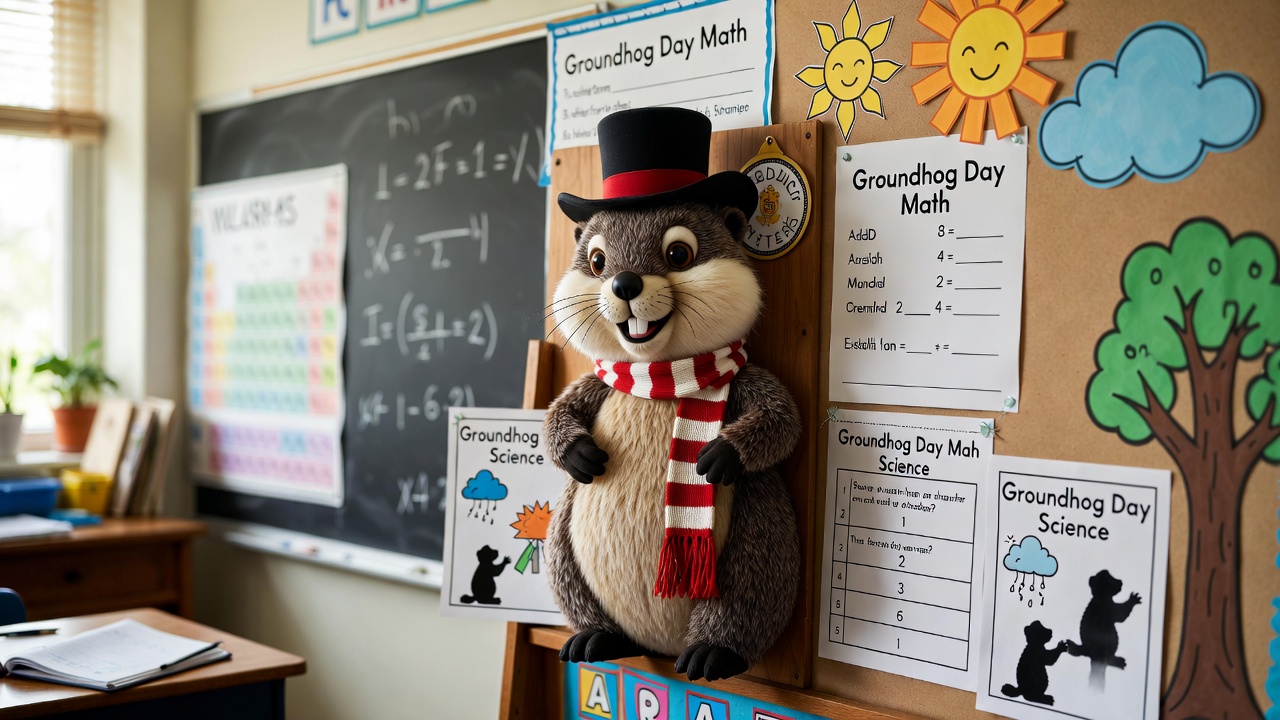
Groundhog Day is a ready-made hook for hands-on lessons about shadows, seasons, and data.
This guide gives teachers Groundhog Day math and science lesson ideas, from measuring shadows and tracking predictions to graphing data and exploring why the seasons change.
The History and Folklore Behind Groundhog Day: Understanding the Cultural Context for Classroom Learning
Before diving into equations and experiments, it’s essential to understand why we celebrate this peculiar holiday in the first place. Groundhog Day represents a fascinating convergence of European folklore, agricultural traditions, and American innovation, a perfect case study in cultural adaptation.
The tradition traces its roots to the ancient Celtic festival of Imbolc, which marked the midpoint between the winter solstice and spring equinox. German immigrants, who settled in Pennsylvania in the 18th and 19th centuries, brought with them Candlemas traditions involving badgers and hedgehogs as weather prognosticators. Finding no hedgehogs in the New World, they substituted the abundant groundhog (Marmota monax), and a distinctly American tradition was born.
| Historical Timeline | Event |
|---|---|
| Ancient Times | Celtic celebration of Imbolc (February 1-2) |
| Medieval Europe | Candlemas Day weather predictions using hedgehogs |
| 1700s-1800s | German immigrants arrive in Pennsylvania |
| 1887 | First official Groundhog Day celebration in Punxsutawney |
| 1993 | Film Groundhog Day brings national attention to the tradition |
| Present | Over 100 groundhog “forecasters” across North America |
This cultural context provides students with essential background knowledge while introducing concepts of migration, adaptation, and the evolution of traditions, all of which can be woven into social studies integration.
Groundhog Day Science Activities for Elementary Students: Exploring Shadows, Light, and the Sun
The central premise of Groundhog Day, that a groundhog seeing its shadow predicts six more weeks of winter, offers a natural entry point into fundamental physics concepts. Shadow science forms the backbone of many state standards for early elementary grades, and this holiday provides concrete, memorable context.
Shadow Investigation Station
Set up a classroom investigation where students explore how shadows form and change. You’ll need flashlights (representing the sun), small figurines or cutouts of groundhogs, and white paper for shadow observation.
Key Learning Objectives:
- Shadows form when an opaque object blocks light
- Shadow length and direction change based on the light source’s position
- The sun’s position in the sky changes throughout the day and across seasons
Activity Procedure:
- Position the “groundhog” on white paper
- Shine the flashlight from different angles (high, low, side)
- Trace the resulting shadows
- Measure and compare shadow lengths
- Discuss: When would a groundhog most likely see its shadow? (Sunny days with the sun at certain angles)
This hands-on exploration helps students understand that the groundhog’s “prediction” actually depends on weather conditions (cloudy vs. sunny) rather than any mystical ability.
The Earth’s Tilt and Seasonal Changes
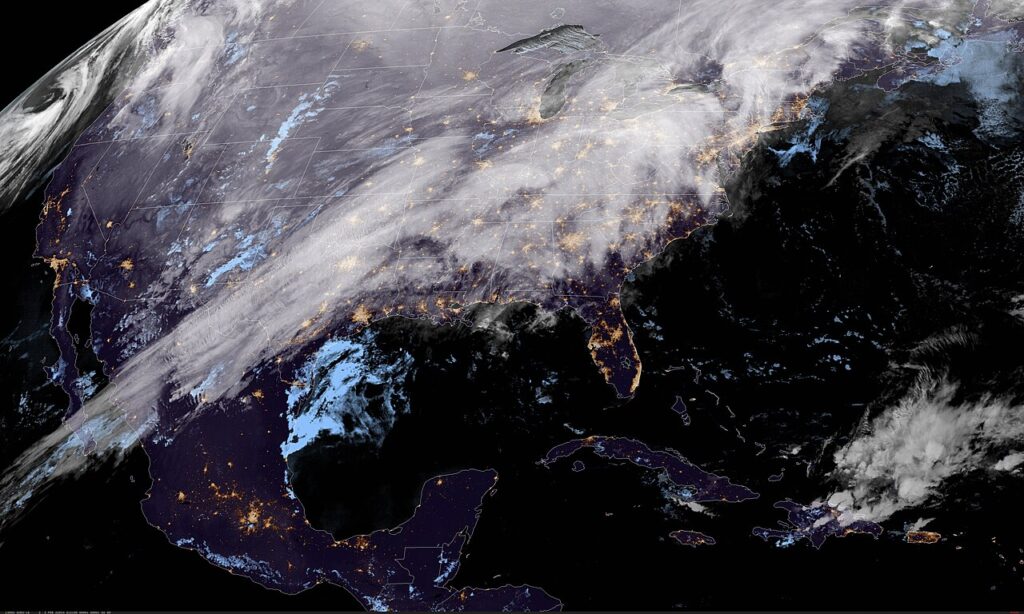
For upper elementary students, Groundhog Day arrives at a perfect time to discuss why we have seasons. February 2nd sits approximately halfway between the winter solstice (December 21st) and the vernal equinox (March 20th), making it an ideal moment to examine Earth’s axial tilt.
| Season | Earth’s Position | Northern Hemisphere Conditions |
|---|---|---|
| Winter Solstice | Tilted away from sun | Shortest day, longest shadows |
| Groundhog Day | Transitional | Increasing daylight hours |
| Spring Equinox | Neutral position | Equal day and night |
| Summer Solstice | Tilted toward sun | Longest day, shortest shadows |
Students can track daylight hours in the weeks surrounding Groundhog Day, creating graphs that visually demonstrate the gradual shift toward spring.
Groundhog Day Math Lessons for Middle School: Probability, Statistics, and Data Analysis
Perhaps no subject pairs more naturally with Groundhog Day than mathematics. The holiday’s predictive nature practically begs for statistical analysis, and over 130 years of recorded predictions provide a robust dataset for student investigation.
Calculating Punxsutawney Phil’s Accuracy Rate
According to the Punxsutawney Groundhog Club’s records, Phil has made predictions since 1887. This extensive historical record allows students to engage in authentic data analysis.
The Data Challenge:
Present students with the historical record and challenge them to calculate Phil’s accuracy rate. This requires:
- Defining “accurate”, what counts as an early spring vs. extended winter?
- Gathering historical weather data for comparison
- Calculating percentage accuracy
- Analyzing patterns over time
Research from various meteorological organizations suggests Phil’s accuracy hovers around 39-40%, which is actually worse than random chance (50%). This counterintuitive finding sparks rich classroom discussion about probability, sample size, and the nature of prediction.
Probability and Prediction: A Standards-Aligned Investigation
| Skill | Common Core Alignment | Activity |
|---|---|---|
| Calculating percentages | 6.RP.A.3 | Determine Phil’s accuracy rate |
| Interpreting data | 6.SP.B.5 | Analyze prediction patterns |
| Understanding probability | 7.SP.C.5 | Compare Phil to random chance |
| Statistical variability | 6.SP.A.1-3 | Examine regional groundhog differences |
Extension Activity: Compare Phil’s predictions with those of other famous groundhog prognosticators:
- Staten Island Chuck (New York)
- Wiarton Willie (Ontario, Canada)
- General Beauregard Lee (Georgia)
- Birmingham Bill (Alabama)
Do groundhogs in different regions show different accuracy rates? What might explain regional variations?
STEM Groundhog Day Projects for High School: Climate Science and Meteorological Analysis
High school educators can leverage Groundhog Day to introduce sophisticated concepts in climate science, statistical modeling, and scientific methodology. The holiday serves as an accessible entry point into discussions about the difference between weather folklore and meteorological science.
Climate Data Investigation Project
Challenge students to conduct a rigorous analysis of whether Groundhog Day predictions have any correlation with actual weather patterns. This multi-week project develops critical research skills:
Phase 1: Hypothesis Formation
- What would need to be true for groundhog predictions to work?
- How might we test these claims scientifically?
Phase 2: Data Collection
- Gather Phil’s historical predictions (available from the Punxsutawney Groundhog Club)
- Obtain historical weather data from NOAA for February-March periods
- Define measurable criteria for “early spring” vs. “six more weeks of winter”
Phase 3: Analysis
- Calculate correlation coefficients
- Perform chi-square tests to determine statistical significance
- Create visualizations of findings
Phase 4: Conclusion and Communication
- Write a scientific report
- Present findings to class
- Discuss limitations of the study
This project aligns with Next Generation Science Standards (NGSS) related to analyzing and interpreting data, using mathematical representations, and engaging in argument from evidence.
The Phenology Connection: When Science Meets Folklore
Phenology, the study of cyclic and seasonal natural phenomena, provides a scientific framework for understanding why traditions like Groundhog Day emerged. Before modern meteorology, people relied on natural indicators to predict seasonal changes.
Phenological Indicators of Spring:
- First appearance of certain bird species
- Emergence of hibernating mammals
- Blooming of early flowers (crocuses, snowdrops)
- Changes in daylight duration
- Soil temperature thresholds
Students can establish a classroom phenology journal, tracking local indicators and comparing them with both groundhog predictions and official weather forecasts. This longitudinal project develops observational skills while connecting students to local ecosystems.
Groundhog Day Math Word Problems and Worksheets: Ready-to-Use Classroom Resources
Teachers often need practical, immediately implementable resources. Below are sample word problems organized by grade level that can be adapted or used directly in your classroom.
Elementary Level (Grades 2-4)
- Shadow Measurement: Phil’s shadow measured 18 inches at 8:00 AM. By noon, his shadow was only 6 inches long. How many inches shorter was his shadow at noon?
- Groundhog Counting: If 12 groundhogs each ate 3 pounds of vegetables to prepare for hibernation, how many total pounds of vegetables did they eat?
- Time Zones: When it’s 7:25 AM in Punxsutawney, Pennsylvania, it’s 6:25 AM in Chicago. Marcy lives in Chicago and wants to watch Phil’s prediction live at 7:25 AM Punxsutawney time. What time should she tune in?
Middle School Level (Grades 5-7)
- Percentage Calculation: Phil has made 138 predictions since 1887. If he predicted an early spring 22 times, what percentage of his predictions called for early spring? Round to the nearest tenth.
- Data Analysis: Over the past 10 years, Phil saw his shadow 7 times. Based on this sample, what is the experimental probability that Phil will see his shadow next year? Express your answer as a fraction, decimal, and percentage.
- Rate Problem: A groundhog’s heart rate during hibernation drops to about 4 beats per minute. Its normal active heart rate is approximately 80 beats per minute. What is the percentage decrease in heart rate during hibernation?
High School Level (Grades 8-12)
- Statistical Analysis: Given that Phil’s accuracy rate is approximately 39% and random chance would yield 50% accuracy, calculate whether this difference is statistically significant using a sample size of 100 predictions and a significance level of α = 0.05.
- Correlation: Using the provided dataset of Phil’s predictions and actual February-March temperatures, calculate the Pearson correlation coefficient. What does this value tell us about the relationship between predictions and outcomes?
Groundhog Day Science Experiments for Kids: Hands-On Learning Activities
Nothing cements learning like hands-on experimentation. These activities transform abstract concepts into memorable experiences while developing scientific thinking skills.
Experiment 1: The Great Shadow Investigation
Question: How does the angle of light affect shadow length?
Materials: Flashlight, ruler, protractor, small toy groundhog, graph paper, data table
Procedure:
- Position the toy groundhog on graph paper
- Shine the flashlight at 90° (directly overhead), 60°, 45°, 30°, and 15° angles
- Measure and record shadow length at each angle
- Graph results (angle on x-axis, shadow length on y-axis)
Expected Results: Students discover an inverse relationship, as the light source angle decreases, shadow length increases. This explains why groundhogs would see longer shadows in early morning (low sun angle) than at noon.
Experiment 2: Temperature and Hibernation
Question: How does temperature affect the activity level of cold-blooded organisms?
Materials: Two identical containers, ice, warm water, thermometers, earthworms or crickets (check school policies)
Procedure:
- Create two environments: cold (around 40°F) and warm (around 70°F)
- Place organisms in each environment
- Observe and record movement/activity levels over 15 minutes
- Compare observations
Connection: While groundhogs are warm-blooded, discussing how temperature affects metabolism helps students understand why animals might hibernate and why emerging in February could be risky.
Experiment 3: Predicting Weather, Can We Do Better Than Phil?
Question: What factors best predict temperature changes?
Materials: Thermometers, barometers, hygrometers (or weather apps), data collection sheets
Procedure:
- Students record daily measurements for 2-4 weeks before Groundhog Day
- Identify patterns between pressure, humidity, and temperature changes
- Make predictions for February-March based on data
- Compare student predictions with Phil’s prediction and actual weather
This long-term project demonstrates the scientific method while showing students that systematic data collection outperforms folklore.
Cross-Curricular Groundhog Day Lesson Plans: Integrating ELA, Social Studies, and Art
The most effective teaching often crosses disciplinary boundaries. Groundhog Day’s rich cultural context enables meaningful integration across the curriculum.
English Language Arts Integration
| Activity | Skills Addressed | Standards Connection |
|---|---|---|
| Write a news report from Punxsutawney | Informational writing, journalism | W.4.2, W.5.2 |
| Compare folklore versions | Compare/contrast, textual analysis | RL.4.9, RL.5.9 |
| Persuasive essay: Should we trust Phil? | Argument writing, evidence use | W.6.1, W.7.1 |
| Research paper on hibernation | Research skills, citation | W.8.7, W.8.8 |
Social Studies Connections
Immigration and Cultural Adaptation: Trace how German Candlemas traditions transformed into American Groundhog Day. Students can research their own family traditions that may have roots in other cultures or countries.
Economics of Celebration: Punxsutawney’s economy depends heavily on Groundhog Day tourism. Students can analyze economic data and discuss how communities benefit from and market their unique traditions.
Indigenous Perspectives: Before European settlement, Native American peoples had their own methods of tracking seasonal changes. Research local indigenous traditions related to seasonal transitions and animal behavior. This provides important context about the multiple knowledge systems that exist for understanding the natural world.
Art and Creative Expression
- Shadow Art: Create artwork using shadow tracing techniques
- Groundhog Habitat Dioramas: Build accurate burrow cross-sections
- Infographic Design: Visualize Phil’s prediction history
- Stop-Motion Animation: Create videos explaining the science of shadows
Assessment Ideas for Groundhog Day Educational Activities: Measuring Student Learning
Effective lessons require thoughtful assessment. Here are various approaches for evaluating student learning from Groundhog Day activities.
Formative Assessment Strategies
Exit Tickets:
- “Explain in your own words why Phil seeing his shadow depends on the weather, not magic.”
- “If Phil’s accuracy rate is 39%, what does that tell us about his predictions?”
Think-Pair-Share:
- Partners discuss whether they would trust a groundhog or a meteorologist, then share reasoning with the class.
Concept Maps:
- Students create visual representations connecting shadows, light, sun position, and seasons.
Summative Assessment Options
Performance Task: Students design their own “prediction system” using scientific data (temperature trends, pressure patterns, daylight hours) and compare their accuracy with Phil’s over a week.
Research Project: Investigate a different animal-based weather folklore tradition and analyze its scientific validity.
Mathematical Analysis Report: Using provided data, students write a report analyzing Phil’s prediction patterns, calculating relevant statistics, and drawing evidence-based conclusions.
Rubric Components for Groundhog Day Projects
| Criteria | Beginning (1) | Developing (2) | Proficient (3) | Exemplary (4) |
|---|---|---|---|---|
| Data Analysis | Minimal calculations | Some calculations with errors | Accurate calculations | Sophisticated analysis with interpretation |
| Scientific Reasoning | Limited explanation | Partial explanation | Clear explanation | Insightful explanation with extensions |
| Communication | Unclear presentation | Somewhat clear | Clear and organized | Exceptional clarity and engagement |
| Connections | Few connections made | Some connections | Strong connections | Novel connections and applications |
Making Groundhog Day Lessons Culturally Responsive and Inclusive
As educators, we must ensure our lessons respect diverse perspectives and avoid perpetuating stereotypes. Groundhog Day offers opportunities for culturally responsive teaching.
Honoring Multiple Knowledge Systems
While we analyze Groundhog Day through a scientific lens, we should acknowledge that many cultures have sophisticated traditional ecological knowledge (TEK) systems. Indigenous peoples across North America developed detailed understanding of seasonal patterns, animal behavior, and weather prediction long before European contact.
Classroom Discussion Prompts:
- “Why might people have developed traditions around animal behavior and weather prediction?”
- “What value might these traditions hold even if they’re not scientifically ‘accurate’?”
- “How do different cultures mark the transition from winter to spring?”
Avoiding Stereotypes
Be cautious about presenting folklore as “primitive” compared to “advanced” science. Instead, frame the discussion around how human understanding evolves and how different knowledge systems serve different purposes.
Global Connections
Explore how other cultures mark the midpoint of winter:
- Imbolc (Celtic): Celebration of the goddess Brigid and returning light
- Setsubun (Japanese): Bean-throwing ceremony to ward off evil spirits and welcome spring
- Candlemas (Christian): Celebration forty days after Christmas
- Li Chun (Chinese): “Start of Spring” in the traditional calendar
This comparative approach builds global awareness while respecting cultural diversity.
Conclusion: Why Groundhog Day Deserves a Place in Your Curriculum
Groundhog Day is far more than a quirky American tradition, it’s a pedagogical goldmine waiting to be excavated. This single holiday offers entry points into physics (shadows and light), earth science (seasons and axial tilt), biology (hibernation and animal behavior), mathematics (probability and statistics), social studies (immigration and cultural adaptation), and language arts (persuasive writing and research).
What makes Groundhog Day particularly valuable is its accessibility. Students already have cultural familiarity with the holiday, providing schema to build upon. The concepts are concrete and observable, shadows, seasons, predictions, rather than abstract. And the data is authentic, stretching back over a century.
As you plan your February curriculum, consider how you might incorporate these lessons. Whether you’re teaching second graders about shadows or high schoolers about statistical significance, Punxsutawney Phil offers a furry, friendly face to attach to otherwise abstract concepts.
And who knows? Perhaps your students will discover something that has eluded researchers for generations, or perhaps they’ll simply gain a deeper appreciation for both scientific inquiry and the enduring power of American folklore.
Measure and Graph Shadow Length Throughout the Day
Groundhog Day is built around one observation: does the animal see its shadow? Turn that single moment into a full math investigation by tracking how shadows change from morning to afternoon. Students discover that shadow length is not random. It follows a predictable pattern tied to the Sun’s position, and that pattern becomes a clean data set for measuring, recording, and graphing.
You will need a sunny day, so plan around the weather and have an indoor backup ready. Gather these materials:
- One vertical object per group, such as a meter stick, a wooden dowel, or a cardboard cutout of a groundhog taped to a stiff base
- Sidewalk chalk or masking tape to mark the ground
- Measuring tapes or yardsticks
- A recording sheet with columns for time, shadow length, and a sketch
Run the activity in these steps:
- Set each object in the same fixed spot outdoors and trace its base so it can be returned to the exact location each round.
- At three or four set times, such as 9 a.m., 11 a.m., 1 p.m., and 3 p.m., have students measure the shadow from the base of the object to the tip and record the length.
- Back in the classroom, build a line graph with time on the horizontal axis and shadow length on the vertical axis.
- Ask students to describe the shape of the line and predict where the shadow would be shortest if they measured at noon.
Strong follow-up questions push the math further. When was the shadow longest? By what percentage did it shrink between the first and middle readings? If the shadow grew by the same amount each hour, what would the next measurement be? This connects measurement, graphing, and early pattern reasoning in one cycle.
Probability and Data: How Accurate Is Punxsutawney Phil?
Phil has been making predictions for well over a century, which gives students a real data set to analyze instead of made-up numbers. The core question is honest and engaging: is Phil actually good at forecasting, or is he no better than a coin flip? Working through the records turns a fun tradition into a lesson on percentages, probability, and the difference between a pattern and pure chance.
Provide students with a simplified table of past predictions broken into two categories, such as how often Phil predicted six more weeks of winter versus an early spring. Then have them work through the following:
- Count the total number of years in the data set and the number of times each prediction was made.
- Calculate the percentage for each outcome by dividing each count by the total and multiplying by 100.
- Build a bar graph comparing the two categories so the difference is visible at a glance.
- Compare Phil’s accuracy rate to a 50 percent baseline, the same odds as flipping a coin.
The discussion is where the real thinking happens. Ask students whether a prediction that is right about half the time is impressive or expected. Have them flip a coin twenty times, record heads and tails, and compare their results to Phil’s track record. This hands-on comparison helps students separate the idea of a reliable forecast from the role of random luck, a concept that underpins all of probability.
Science of Shadows: The Sun’s Angle and the Seasons
Once students have measured shadows, they are ready to learn why shadows form and why they change. A shadow appears whenever an opaque object blocks light, leaving a dark area where the light cannot reach. The length and direction of that shadow depend on the angle of the light source, which for outdoor shadows is the Sun.
Use a flashlight and a small figure to model the idea indoors. Hold the flashlight directly overhead to make a short shadow, then lower it toward the table to stretch the shadow long. Students quickly see that a low Sun makes long shadows and a high Sun makes short ones. Connect this to the time-of-day graph they already built.
From there, introduce the seasonal piece. Earth is tilted on its axis, and as it orbits the Sun, that tilt changes how high the Sun climbs in the sky across the year. In winter the Sun stays lower, so shadows at noon are longer than they are in summer. Groundhog Day falls on February 2, which is a cross-quarter day sitting roughly halfway between the winter solstice and the spring equinox. That midpoint is exactly why so many cultures marked early February as a turning point toward spring, long before any groundhog was involved. Have students predict how the same shadow measurement would differ if they repeated the activity in June.
Hibernation and Animal Adaptation
Groundhogs are true hibernators, and that makes them a perfect entry point into a life science lesson on how animals survive winter. During hibernation a groundhog’s body temperature drops dramatically, its heart rate slows from over a hundred beats per minute to just a handful, and it lives off the fat it stored during fall. Students are often amazed that an animal can sleep through months of cold without eating.
Frame the lesson around a few guiding questions and short investigations:
- What does a groundhog do to prepare its body before winter, and why does eating extra food in fall matter?
- How is hibernation different from regular sleep or from migration, the strategy many birds use instead?
- What other animals in your region hibernate, and what do they have in common?
For a memorable demonstration of insulation, give pairs a thermometer and have them wrap one in cotton or fleece to mimic a fat layer and burrow, leaving another exposed. After a set time, compare how each holds warmth. This connects the abstract idea of adaptation to something students can measure, and it reinforces why a deep burrow keeps a groundhog safe through the cold.
A Cross-Curricular Writing and Literacy Tie-In
The data and science work pairs naturally with writing, which helps students explain their reasoning and turns a holiday into a literacy opportunity. Because students already have measurements, predictions, and evidence, they have plenty of material to write about with confidence.
Offer a menu of writing tasks so students can choose a format that fits the lesson and their grade level:
- Write a short weather forecast in the voice of a TV reporter, using the class data to predict an early spring or a longer winter.
- Compose a persuasive paragraph arguing whether Phil’s predictions should be trusted, citing the percentage students calculated.
- Create an informational poster explaining how shadows form, with a labeled diagram of the Sun, an object, and its shadow.
- Draft a journal entry from a groundhog’s point of view describing waking up from hibernation.
Each task asks students to organize evidence and use vocabulary from the science and math activities, which deepens understanding far more than a worksheet alone.
Adapting These Lessons by Grade Level
Every activity here can scale up or down so the same Groundhog Day theme works across a wide range of ages. Adjust the complexity of the measurement, the math, and the writing to match your students.
For early elementary, keep it concrete and visual:
- Compare shadows as simply longer or shorter rather than measuring exact lengths.
- Sort prediction outcomes into two picture columns instead of calculating percentages.
- Focus the science talk on the idea that animals sleep and hide to stay warm in winter.
For upper elementary, add precision and reasoning:
- Measure shadows in centimeters and build accurate line and bar graphs.
- Calculate percentages and compare Phil’s accuracy to a coin flip.
- Explain how Earth’s tilt connects to longer winter shadows.
For middle school, push toward analysis and argument:
- Calculate ratios and rates of change in shadow length and discuss whether the change is linear.
- Use the prediction data to discuss sample size, probability, and why a large data set matters.
- Research the astronomy of cross-quarter days and write an evidence-based claim about the tradition.
With these adjustments, a single Groundhog Day theme can anchor a meaningful week of math, science, and writing for nearly any classroom.
More Groundhog Day Guides
Explore the rest of our Groundhog Day coverage, from its history to activities and forecasts:
- Why Do We Celebrate Groundhog Day? (Start Here)
- The Legend of Groundhog Day: Origins and Myths
- When Is Groundhog Day 2026? Date and History
- Punxsutawney Phil’s Accuracy: How Reliable?
- 100 Fun Questions and Answers About Groundhog Day
- Groundhog Day Activities and Crafts for Kids
- Groundhog Day Around North America
Frequently Asked Questions
How can I teach Groundhog Day in math?
Have students measure and compare shadow lengths, graph yes or no predictions, or calculate the percentage of years Phil saw his shadow.
What science topics fit Groundhog Day?
Shadows and light, the seasons and Earth’s tilt, animal hibernation, and weather prediction all connect naturally.
What grade levels does Groundhog Day suit?
Activities can be scaled from early elementary (simple shadow play) to middle school (data and graphing).
When is Groundhog Day 2026?
Monday, February 2, 2026.